
Q4 was a busy quarter, especially considering activity tends to wane as the year closes. Applications were the highest of any quarter in 2023 and jobs equalled the 2022 quarterly average. What they didn’t equal was the pace of growth – an indication that as the year ended, the market was re-setting, shifting the balance from candidate-led to a more even keel between candidate and employer.
Quarterly performance
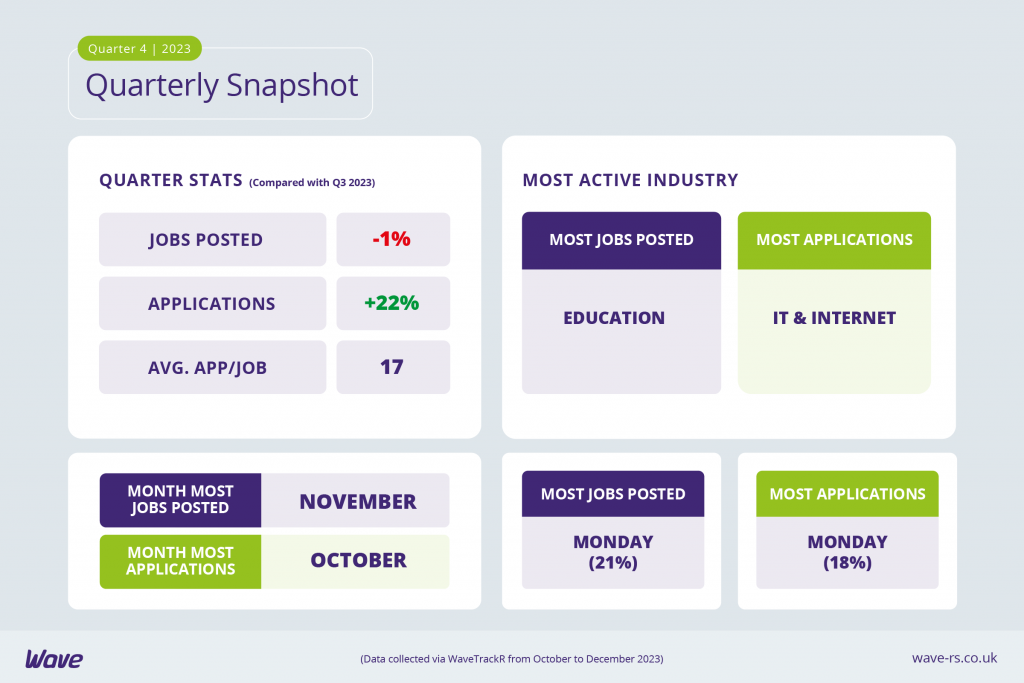
- Applications continued their upwards trajectory in Q4, reaching 54% over the quarterly average for 2022 and a 22% increase on the previous quarter.
- Jobs equalled the 2022 quarterly average and decreased on Q3, although only by 1%.
- The average application per job in Q4 was 17, a rise of 3 from Q3.
- IT & Internet received the largest percentage of applications in Q4 but Education took the top spot for jobs posted.
- Monday was the most active day in recruitment in Q4, with the first day of the working week being the day that the the majority of jobs were posted as well as the majority of applications received.
- October saw the most applications of Q4 (and in fact the entire year) but the highest percentage of jobs were posted in November.
Job posting and applications per month
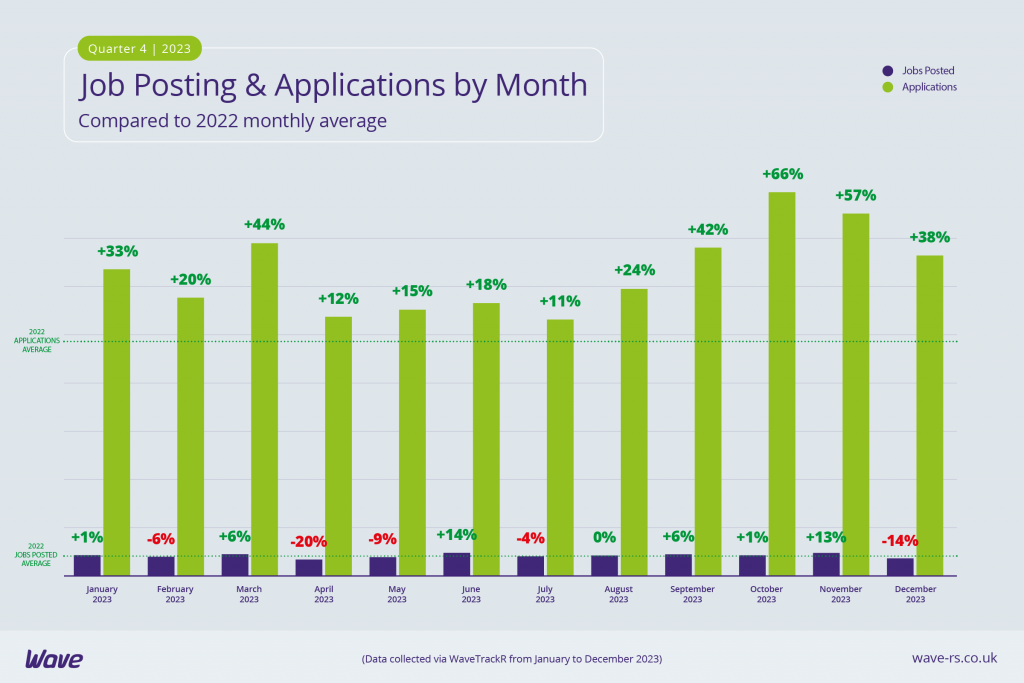
Following a lacklustre Q3 in terms of applications, Q4 was a busy quarter for candidates. October recorded the highest percentage of applications all year, hitting 66% over the 2022 monthly average. November’s numbers dipped slightly but still equated to the second highest of the year. As the year came to an end we usually expect all recruitment activity to fall dramatically but applications only dropped to 38% over the 2022 monthly average, which puts the figures in the top half for the year.
Jobs remained fairly steady in October and November but dropped by quite a margin in December – a seasonal trend but one that makes the consistently high application numbers all the more noteworthy. It seems the market is resetting after the crazy hiring rush of 2021/2022. Jobs are staying at a fairly even keel but applications are increasing – not a bad situation for recruiters. And with the cost of living still an issue for many, we can expect application numbers to remain high as we head into 2024.
Job posting & applications by quarter
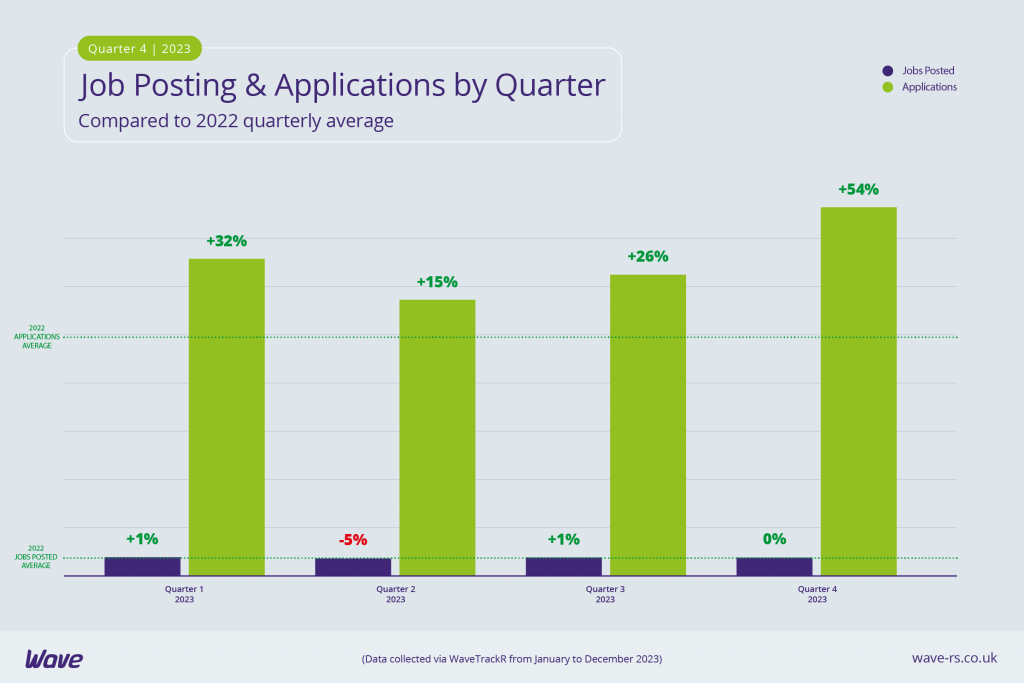
The headlines in the press in 2023 consistently lamented falling jobs in the UK’s labour market. However, that is not what Wave data has found. Other than a slight fall in Q2, jobs have remained at a fairly consistent level, akin to the 2022 quarterly average. What this indicates is a levelling out of the market. The pace of jobs has fallen from the hiring surges immediately following the pandemic but job numbers have remained at a consistent level.
Meanwhile, applications remain high. In each quarter across 2023, they rise well above the 2022 quarterly average, peaking in Q4 at 54% above it. We have certainly seen more candidates entering the market in Q4, some as they take on second jobs to help with the cost of living, others coming out of retirement for similar reasons. An increase in hybrid jobs on the market may have helped a range of candidates that would struggle to work a full time office job (eg carers, parents, those with neurodivergencies or disabilities) to enter or re-enter the market. Seasonal jobs generally push up application figures but as jobs fell slightly in Q4 that may not be such a reason this year.
Industries with most jobs and applications
Education has stormed into the top spot for volume of jobs posted in Q4, taking the lead from IT & Internet. From 15% of all jobs in Q3 to 26% in Q4 and 8 percentage points ahead of IT & Internet, Q4 was a busy period for the Education industry. Given its busiest period tends to be Q2, when schools are lining up staff for the start of the new academic year in September, this is significant. However, the industry is also joint top for applications, indicating that supply is likely meeting demand.
IT & Internet remains an incredibly active industry, in the top 2 for both jobs posted and applications received. Health & Nursing, Manufacturing and Public Sector & Services all remain in the top 5 for jobs posted but only Manufacturing from that trio is also pulling in the applications. This suggests that Health & Nursing and Public Sector & Services are both still experiencing labour shortages. Meanwhile, Engineering & Utilities and Secretarial, PAs & Admin are both receiving a relatively high number of applications but without the job numbers to match.

Average application per job by industry
With an increase in seasonal jobs and a need by many to take on a second job in the run-up to Christmas, it’s perhaps unsurprising that Retail & Wholesale racked up an average of 109 applications per job in Q4. Roles in the industry can also fit around other jobs as they include evening and weekend work, a trait Retail shares with Customer Service, which received the second highest average number of applications per job in Q4 (73). Also in the top 5 is Banking (the highest in Q3), Recruitment Sales (perhaps as a result of redundancies in certain areas of the industry in the latter half of the year), and Secretarial, PAs & Admin.
Health & Nursing yet again finds itself receiving the lowest average number of applications per job – just 1. The historic skills shortages the industry shares with Public Sector & Services (also in the bottom 5) has meant consistently low application numbers. At an average of just 3 applications per job, Electronics has the second lowest average numbers of applications per job across all industries, something that could be attributed to a skills shortage in the industry, highlighted by this McKinsey report.

Average application per job board
The order of the job boards producing the highest average numbers of applications per job haven’t changed, although the numbers have. JobServe comes out on top with very similar numbers in Q4 to Q3 (97 and 96 respectively). Caterer received the next highest, but at 83 in Q4 from 41 in Q3, it more than doubled its average application per job figures, likely due to an increase in demand in the lead-up to the festive period. Secs in the City came in 3rd, with an average of 44 applications per job – 4 over their Q3 figures.
The first generalist job board to chart is Totaljobs, with an average of just over half of Secs in the City’s figures. CV Library and Reed – the next 2 generalist job boards – received an average of 9 applications per job each.


